The question most plants never ask:
How much power are you using to convey 1 TPH of your product across your pneumatic conveying system?
In pneumatic conveying systems, power consumption is often treated as a fixed cost accepted, not questioned. In reality, most dense phase systems consume more power than necessary simply because they were never measured, analyzed, or optimized after commissioning.
This article explains how dense phase pneumatic conveying works, why it is inherently energy-efficient compared to dilute phase, and how real-time instrumentation and feedback loops can significantly reduce operating power per tonne conveyed.
Dense Phase vs Dilute Phase – The Fundamentals
The foundation of power optimization begins with understanding the conveying regime.
Dense Phase Conveying
- Flow type: Non-suspension flow (material moves in plugs, dunes, or slugs)
- Phase density: 10 to >100 kg material per kg of air
- Conveying velocity: 3–10 m/s
- Operating pressure: 2–6 bar
- Typical line sizes: 50–125 mm
- Flow type: Suspension flow (air carries material)
- Phase density: <10 (typically 4–6)
- Conveying velocity: 20–30 m/s
- Operating pressure: Up to 1 bar
- Typical line sizes: 80–250 mm
Lower velocities and higher solids loading make dense phase the preferred solution for abrasive, friable, or high-throughput materials, while also reducing pipeline wear and product degradation.
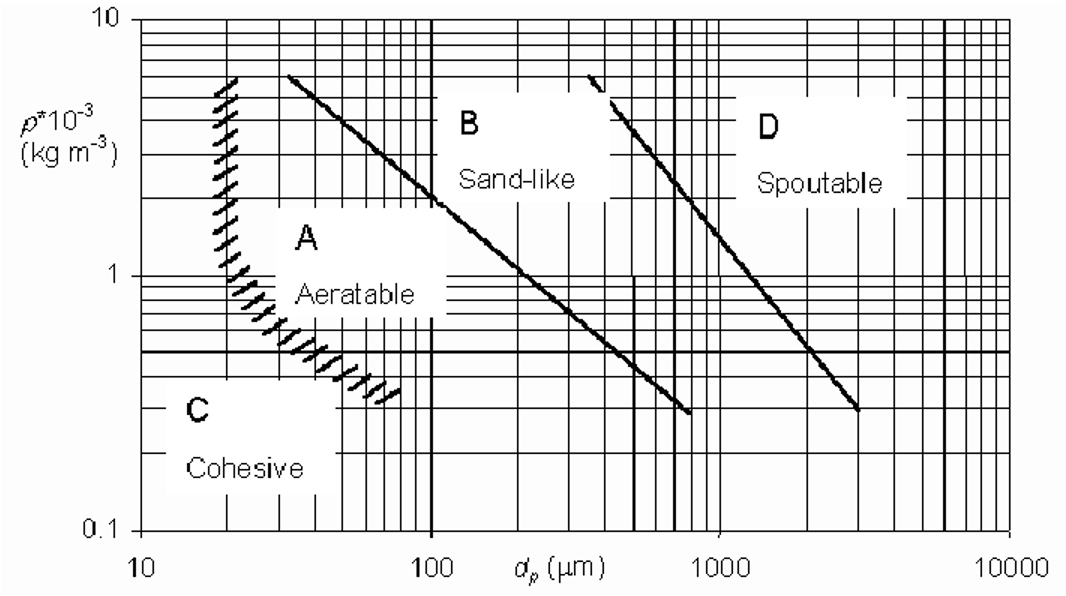
Confirming Whether a Product Is Suitable for Dense Phase
Not all materials behave the same. A reliable dense phase design starts with:
- Geldart fluidization classification
- Academic material data
- Vendor test data and experience
Once conveyability is confirmed, the system is engineered by selecting:
- Target phase density (specific to your powder)
- Required conveying capacity
- Bulk density of the product
Example Design Logic Optimization
Decide and calculate these parameters from fundamentals:
- Standard cycles
- Batch size
- Vessel volume
- Required air flow
- Estimated pressure drop: 2–5 bar
This approach ensures controlled flow with minimal excess air, which is the first step toward power efficiency.
Real-World Case Study: Cement Conveying from Ship to Shore
Large-scale dense phase systems clearly demonstrate how power scales with intelligent design.
System 1
- Capacity: 370 TPH
- Pipeline: 450 mm dia, 384 m, 9 bends
- Air flow: 288 m³/min @ 2.8 bar
- Phase density: 21.4
- Achieved capacity: 320 TPH
System 2
- Capacity: 320 TPH
- Pipeline: 400 mm dia, 236 m, 5 bends
- Air flow: 288 m³/min @ 2.5 bar
- Phase density: 18.5
System 3
- Capacity: 600 TPH
- Pipeline: 400 mm dia, 101 m, 4 bends
- Air flow: 432 m³/min @ 3 bar
- Phase density: 23.14
These installations show that higher throughput does not automatically mean higher power consumption when phase density, pressure drop, and air volume are optimized.
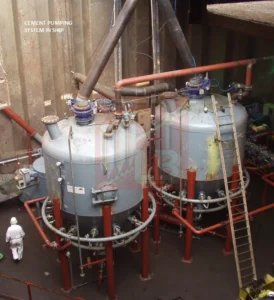
SCORPIO DENSE PHASE SYSE IN THE SHIP HOLD
The Question Most Plants Never Ask
How much power are you using to convey 1 tonne per hour of your product over your conveying distance?
Very few plants can answer this because:
- Air flow is rarely measured accurately
- Solids flow is assumed, not logged
- Pressure data is fragmented
- Power consumption is not normalized against throughput
Without data, optimization is impossible.
Power Optimization Through Instrumentation
Scorpio’s Power Optimization Program addresses this gap by installing real-time measurement and feedback systems, either permanently or as an audit.
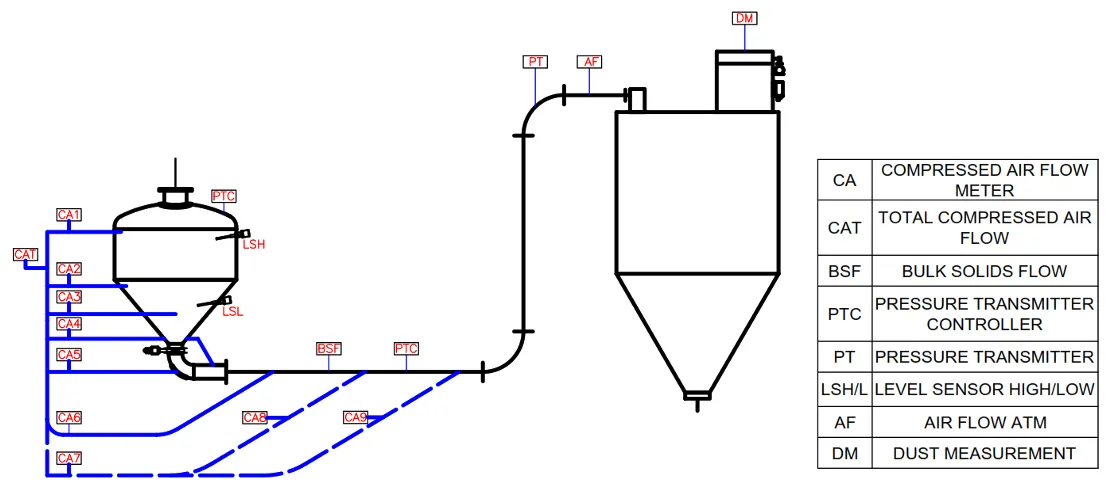
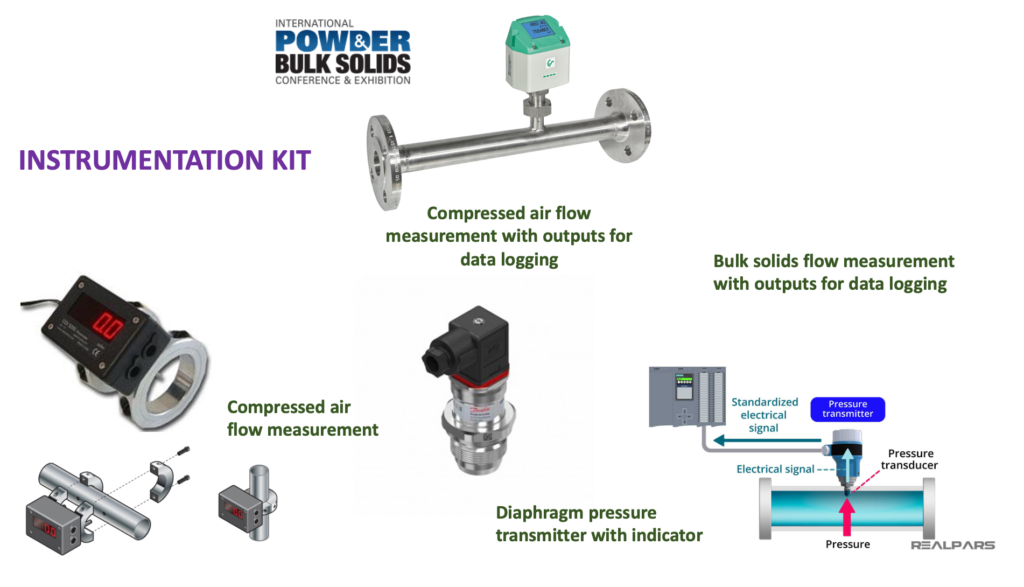
Key Instrumentation
- Compressed air flow measurement (with data logging outputs)
- Bulk solids flow measurement
- Diaphragm pressure transmitters with indicators
- Central power optimizer control panel
What the System Delivers
- Real-time power usage vs material conveyed
- Exact kW per tonne conveyed
- Immediate identification of over-airing or excessive pressure
- Data-driven tuning of operating parameters
The result is a system that uses only the power required to move the material—nothing more.
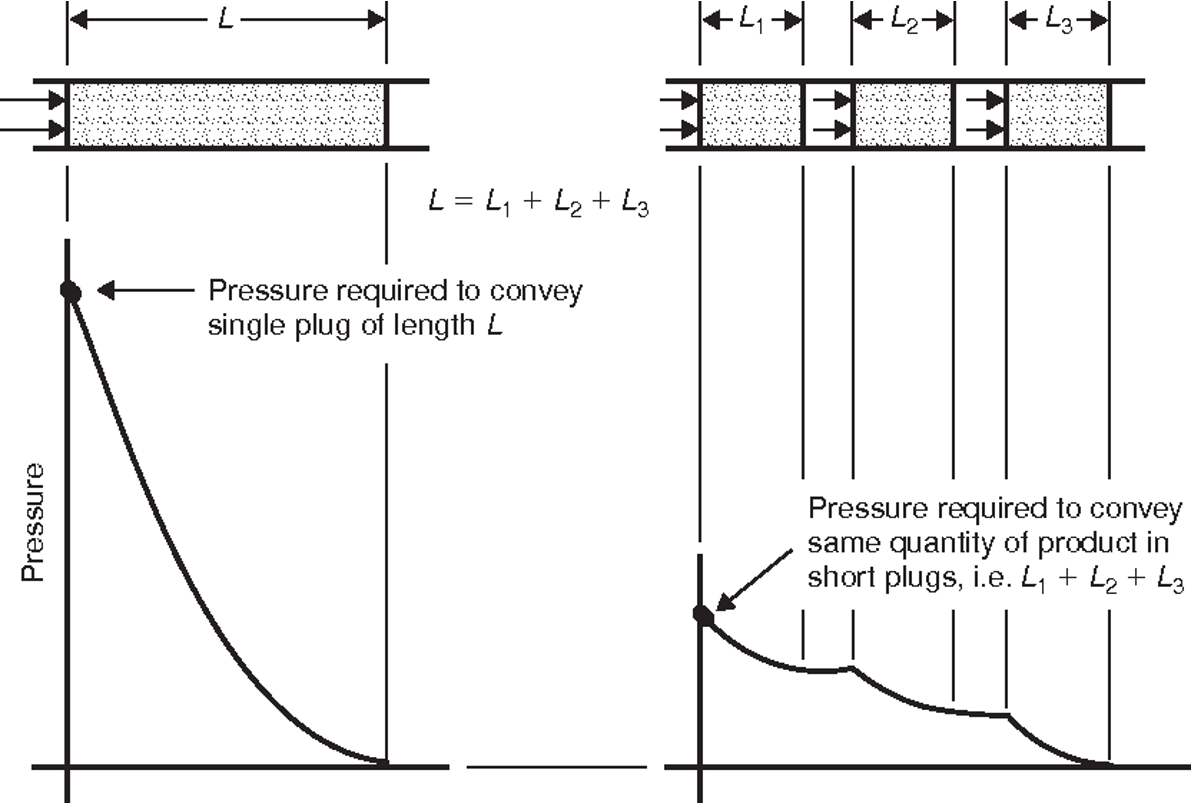
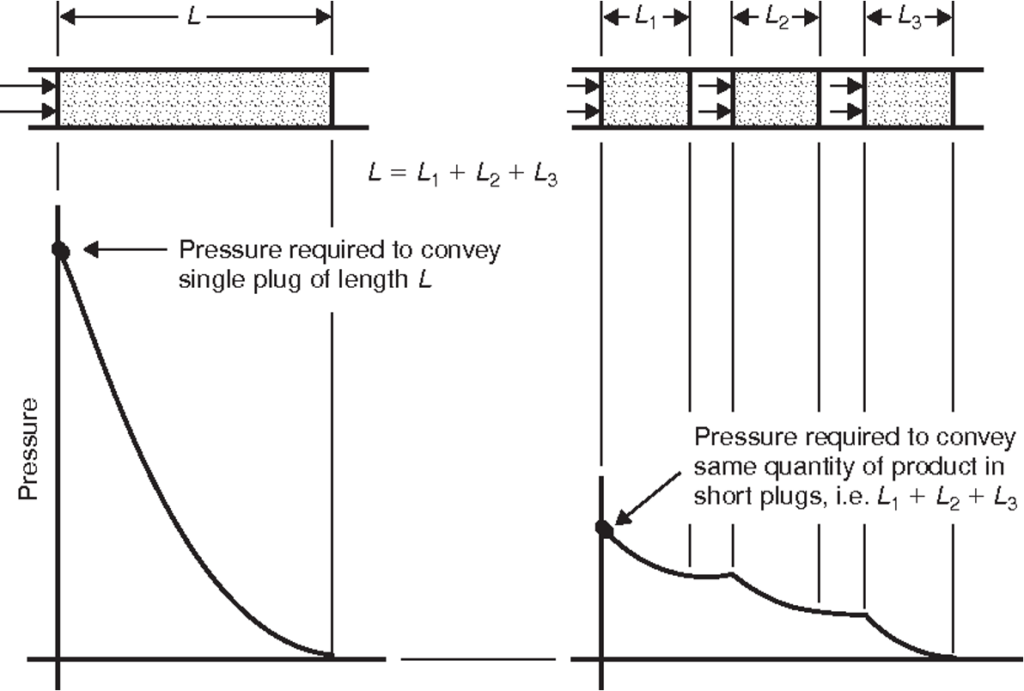
Pressure Drop Reduction = Power Reduction
Reducing unnecessary pressure drop across pipelines, bends, and control elements has a direct impact on compressor power consumption.
With accurate feedback loops, operators can:
- Lower air flow while maintaining throughput
- Reduce compressor load
- Extend pipeline and valve life
- Improve system stability
Conclusion
Dense phase pneumatic conveying is already one of the most efficient methods for handling bulk solids. However, true efficiency is achieved only when systems are measured, analyzed, and optimized in real time.
By combining engineering fundamentals with intelligent instrumentation, plants can:
- Quantify real operating costs
- Reduce power per tonne conveyed
- Improve long-term system performance
FREQUENTLY ASKED QUESTIONS
Because it uses lower air velocity and higher material loading, reducing unnecessary air usage and power consumption.
By measuring total power consumption and dividing it by actual material throughput (tonnes conveyed).
Excess air flow, high pressure drop, poor system design, and lack of real-time monitoring.
Yes. With proper instrumentation and data tracking, most systems can be optimized without major redesign.
Cement, chemicals, food processing, minerals, and any industry handling abrasive or fragile materials.